Slope and area
Associate slope with rate of change and area with accumulation. Theory, formulas, worked examples and interactive graphs.
What it is
Slope measures how much the vertical quantity changes when the horizontal quantity advances. On a graph, it answers "at what rate does this change with respect to that". Area under a curve measures accumulation: it adds small contributions over an interval.
They are not interchangeable operations. Slope reads local or average steepness; area reads total accumulated amount. In physics, this separates velocity from displacement, force from impulse, power from energy, and current from charge.
Why it appears in physics
It appears because many physical laws ask not only for a value, but for changes and accumulations. On a position-time graph, slope is velocity. On a velocity-time graph, area is displacement. On a force-time graph, area is impulse.
It also appears in work, electricity, thermodynamics, and fluids. A curve may tell how much is transferred, how much accumulates, or how fast a quantity changes, provided the axes are identified correctly.
Visual or geometric idea
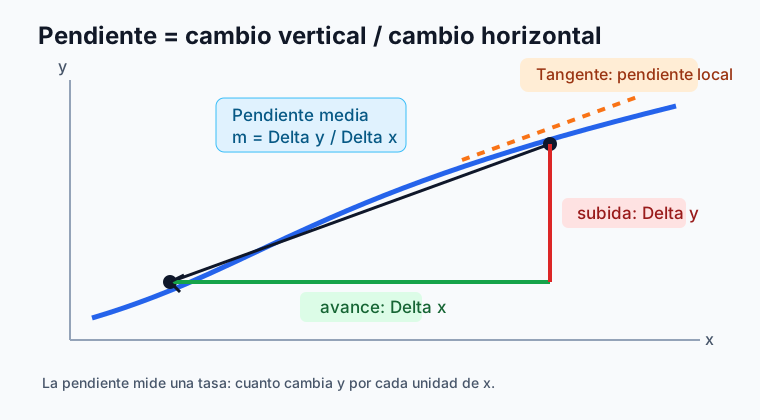
Slope appears as steepness. If a line rises a lot for each horizontal step, the rate of change is large and positive. If it falls, the slope is negative. If it is horizontal, the vertical quantity does not change with the horizontal one.
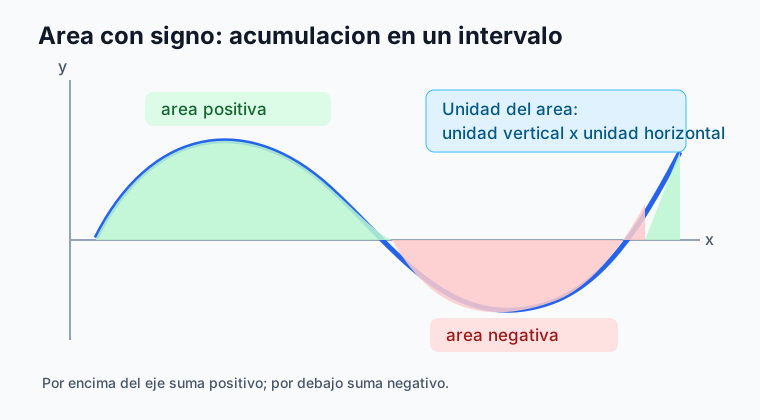
Area appears as a region. If the curve lies above the horizontal axis, signed area is positive; if it lies below, it is negative. In a physical graph, that region is not just geometry: its units come from multiplying the units of the two axes.
Minimal symbolic language
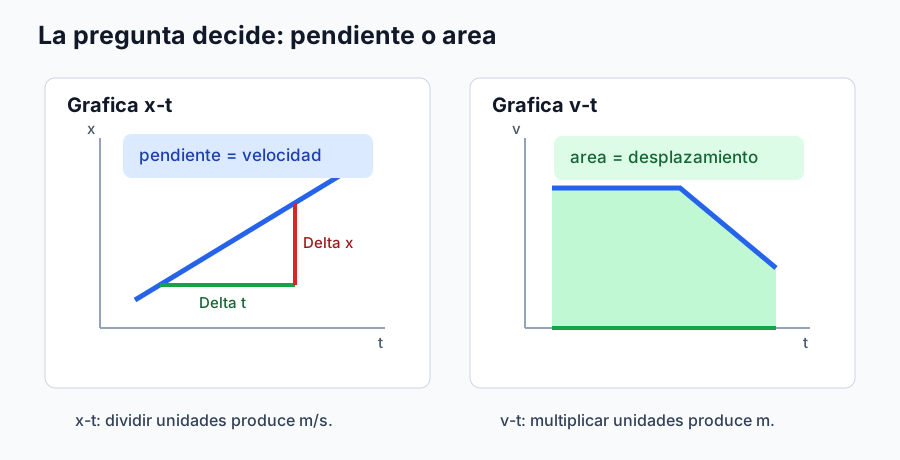
Average slope between two points is written as vertical change divided by horizontal change: m = Delta y / Delta x. In physics, if the axes are x (m) and t (s), then Delta x / Delta t has units m/s and is interpreted as average velocity.
Accumulated area is represented as a sum of rectangles or, at advanced level, as an integral. If the axes are v (m/s) and t (s), the product v Delta t has units m, so area under a velocity-time graph represents displacement.
What the result means
The result of a slope is a rate: "how much the vertical quantity changes per unit of the horizontal quantity". Its unit is a quotient of units. A slope of 3 m/s in a position-time graph means position increases 3 m each second on that interval.
The result of an area is an accumulation. Its unit is the product of the axis units. An area of 12 N s under a force-time curve is not a force: it is impulse, and it measures change in momentum.
When not to use it
Do not use slope when the question asks for accumulated amount over an interval. If a velocity-time graph asks for total displacement, calculating only a slope answers a different question. Do not use area when the question asks for instantaneous rate of change.
Do not ignore sign or units. A negative area may indicate displacement in the negative direction, extracted work, or charge transferred in the opposite sense. A visually steep slope on compressed axes is not accepted by appearance: it must be calculated with the real scales.
Operational summary
First identify axes, units, and interval. If the question says "rate", "change rate", "speed of change", or "steepness", think slope. If it says "total", "accumulated", "displacement", "work", "impulse", or "charge", think area.
The basic level is distinguishing rise, fall, region, and sign. The intermediate level is computing average slope and simple areas with units. The advanced level is interpreting instantaneous slope, signed areas, piecewise intervals, and the link with derivatives and integrals.
Procedure
Before calculating
Read the question before looking for a formula. If it asks for "rate of change", "velocity", "slope", "rate", or "per unit", you probably need slope. If it asks for "total", "accumulated", "displacement", "impulse", "work", or "charge", you probably need area.
Also check the interval. A slope may be computed on a specific segment, between two points, or at one point if a tangent is available. An area always needs a horizontal interval and a reference for deciding sign.
Step 1: identify the mathematical object
Write what each axis represents with units: for example t (s) horizontally and v (m/s) vertically. Then decide whether you have a line, a curve, a piecewise graph, or a data cloud. The shape constrains the method.
For a line, slope is constant and any two well-read points are enough. For a curve, average slope uses two points on the interval and instantaneous slope requires a tangent or derivative. For area, separate rectangles, triangles, trapezoids, or curved regions.
Step 2: choose the operation
Use slope if the answer must be a rate with quotient units. On an x-t graph, Delta x / Delta t gives average velocity. On a v-t graph, Delta v / Delta t gives average acceleration.
Use area if the answer must be an accumulation with product units. On v-t, area gives displacement. On F-t, area gives impulse. On P-t, area gives transferred energy.
Step 3: preserve units and signs
The unit of a slope comes from dividing the vertical unit by the horizontal unit. Do not write only the number: 4 is not the same as 4 m/s or 4 N/m.
The unit of an area comes from multiplying axis units. The sign depends on whether the curve lies above or below the horizontal axis, or whether the vertical quantity is positive or negative. If there are intervals with different signs, compute each region separately.
Step 4: calculate
For average slope, choose two readable points and calculate Delta y / Delta x. Use signed differences: final point minus initial point. If the segment is horizontal, the slope is zero even if the vertical value is not zero.
For simple area, decompose the region into known shapes. A rectangle is base times height, a triangle is base times height divided by two, and a trapezoid is base times the sum of heights divided by two. If the curve is irregular, approximate with rectangles or trapezoids and state that it is an estimate.
Step 5: interpret the result
Turn the number into a physical sentence. A slope of -2 m/s on a position-time graph means position decreases two meters per second. An area of 15 m on a velocity-time graph means net displacement of fifteen meters.
If the result is negative, explain the sense. If the result is zero, distinguish between "no change", "positive and negative areas cancel", and "the vertical quantity is zero". These situations do not mean the same thing.
Self-check checklist
Before submitting, verify: axes read, units written, interval marked, operation chosen by the question rather than habit, sign checked, scale used correctly, and final physical sentence included.
At basic level, recognizing slope versus area is enough. At intermediate level, compute with shapes and quotients. At advanced level, decide between average and instantaneous, geometric and signed area, and justify approximations.
Guided example
Physical situation
A cart moves along a straight line. The position-time graph passes through (t = 2 s, x = 4 m) and (t = 6 s, x = 16 m). Then another velocity-time graph shows v = 3 m/s constant between t = 0 s and t = 5 s.
The first question asks at what rate position changes. The second asks how much displacement accumulates during five seconds.
Mathematical translation
On the position-time graph, slope is needed because the question asks for a rate of change. The operation is Delta x / Delta t and the expected unit is m/s.
On the velocity-time graph, area is needed because the question asks for accumulated displacement. The operation is base times height and the expected unit is (m/s) s = m.
Step-by-step calculation
For the slope: Delta x = 16 m - 4 m = 12 m and Delta t = 6 s - 2 s = 4 s. Therefore the average slope is 12 m / 4 s = 3 m/s.
For the area: the region under v = 3 m/s between 0 s and 5 s is a rectangle. Its base is 5 s and its height is 3 m/s, so the area is 15 m.
Reading the result
The slope of 3 m/s means that, on that segment, position increases three meters each second. The area of 15 m means the cart accumulates fifteen meters of displacement over the interval.
The numerical similarity must not confuse the meaning: a slope 3 m/s and an area 15 m are different physical objects. One measures rate; the other measures accumulation.
Common error avoided
The avoided error is using slope on the velocity-time graph to answer displacement. The slope of that graph would be acceleration, and here it would be zero because velocity is constant. But zero acceleration does not mean zero displacement: the cart moves with constant velocity and accumulates area.
Inverse example
Given result
On a force-time graph, a signed area of -8 N s is calculated between t = 1 s and t = 3 s. The negative sign appears because the force lies below the horizontal axis during that interval.
What physical question it can answer
This result answers what impulse acts on the body in that interval and in which sense. The physical question would be: "what change in momentum does the force produce between 1 s and 3 s?". It does not answer the maximum instantaneous force or whether energy increased; those questions require other data or another graph.
Common errors
Error 1: choosing the wrong operation
It may seem reasonable to always calculate slope or always calculate area when a graph appears. It fails because each operation answers a different question. On v-t, slope gives acceleration, but area gives displacement. Detect it by reading the verb in the prompt: rate of change asks for slope; accumulated total asks for area. Correct it by writing the physical question first.
Error 2: losing the meaning of the variable
This error appears when x and y are treated as empty letters. If the vertical axis changes from position to velocity, the same operation changes meaning. Detect it by checking labels and units before calculating. Correct it by writing one line: "vertical divided by horizontal means..." or "vertical times horizontal means...".
Error 3: ignoring units
A slope without units is disconnected from physics. For example, Delta x / Delta t = 5 must be read as 5 m/s if the axes are meters and seconds. In an F-t area, the unit is N s, not N. Detect it by checking whether the final unit is a quotient or a product. Correct it by operating with units too.
Error 4: confusing sign and magnitude
A negative area or negative slope does not mean "impossible quantity". It means opposite sense, decrease, or signed accumulation. On a velocity-time graph, negative area is displacement in the negative direction. Detect it by comparing the curve with the horizontal axis. Correct it by separating magnitude, sign, and physical meaning.
Error 5: applying a rule outside its domain
Computing a slope from two distant points on a curve and calling it instantaneous is a domain error. Extrapolating an area outside the measured interval is another one. Detect it by asking whether the result describes a point, a segment, or an unobserved extension. Correct it by stating the interval and the type of approximation.
Quick detection rule
If the result has vertical unit divided by horizontal unit, it must be interpreted as a rate. If it has vertical unit multiplied by horizontal unit, it must be interpreted as accumulation. If the final unit does not match the physical question, the operation was almost certainly chosen incorrectly.
Physical applications
1. Kinematics
It appears in x-t, v-t, and a-t graphs. The slope of x-t calculates velocity, the slope of v-t calculates acceleration, the area of v-t calculates displacement, and the area of a-t calculates change in velocity. The result means change or accumulation depending on the graph. The dangerous error is answering displacement with the slope of velocity-time or answering acceleration with area.
2. Mechanical work
It appears in force-position graphs. The area under F(x) calculates work when the force acts along the displacement direction. The result means energy transferred by a force over a distance. The dangerous error is using only the maximum force and forgetting that work depends on the whole traveled interval.
3. Impulse and momentum
It appears in force-time graphs, especially in collisions and short pushes. The area under F(t) calculates impulse. The result means change in momentum with sign and direction. The dangerous error is comparing a very large force for a short time with a smaller force for a long time without comparing areas.
4. Electricity
It appears in current-time and power-time graphs. The area under I(t) calculates transferred charge, and the area under P(t) calculates electrical energy. The result indicates how much has flowed or how much energy has been supplied. The dangerous error is reading only the instantaneous value and losing the temporal accumulation.
5. Laboratory and data fitting
It appears when estimating rates from experimental measurements. The slope of a fitted line may represent resistance, spring constant, cooling coefficient, or average speed, depending on the axes. The result means a physical parameter only if units and model are coherent. The dangerous error is calculating a visual slope without scale or accepting a line outside the measured domain.
Practice
Level 1: recognition
Look at three graphs: x-t, v-t, and F-t. For each one, write what calculating slope would mean and what calculating area would mean. Do not calculate yet; only identify the operation and the resulting physical quantity.
Mentally mark regions where the curve rises, falls, is horizontal, lies above the axis, and lies below the axis. Explain what sign the slope would have and what sign the area would have in each region.
Level 2: direct application
Calculate the average slope of a position-time graph passing through (1 s, 2 m) and (5 s, 14 m). Write the quotient, the unit, and a physical sentence beginning with "position changes...".
Calculate the area under a rectangular velocity-time graph with v = 4 m/s between t = 0 s and t = 6 s. Write the result in meters and explain why it is not a velocity.
Level 3: choosing the tool
Decide whether each question asks for slope, area, or direct reading: "what average velocity did the object have?", "what net distance did it travel?", "what value did the force have at 2 s?", "what impulse did it receive?". Justify each choice with a keyword from the prompt.
Compare a triangular v-t graph with base 8 s and height 6 m/s with a rectangular graph of base 4 s and height 6 m/s. Calculate both areas and explain which one produces greater accumulated displacement.
Level 4: physical interpretation
A v-t graph has positive area 20 m and negative area -8 m. Calculate net displacement and explain why it does not necessarily match total distance traveled.
An F-x graph shows force increasing from 0 N to 10 N over 3 m. Calculate the work if the region is triangular. Explain what each unit in N m represents and why it is equivalent to joules.
Level 5: intentional error
A learner sees a constant velocity-time graph v = 5 m/s for 4 s and writes: "the slope is zero, therefore displacement is zero". Locate the error, explain which question slope answers, and correct the displacement calculation.
Another learner calculates a negative area under a force-time curve and removes the sign because "area is always positive". Correct the reasoning: distinguish geometric area from signed area, state what the sign would mean for impulse, and write a complete physical interpretation.