Comparison and validation
A guide to comparing results with references, uncertainties, data, and independent methods.
Check through an independent route
Validation is not repeating the same operations. It means obtaining a second piece of evidence capable of revealing an error shared by the whole first route.
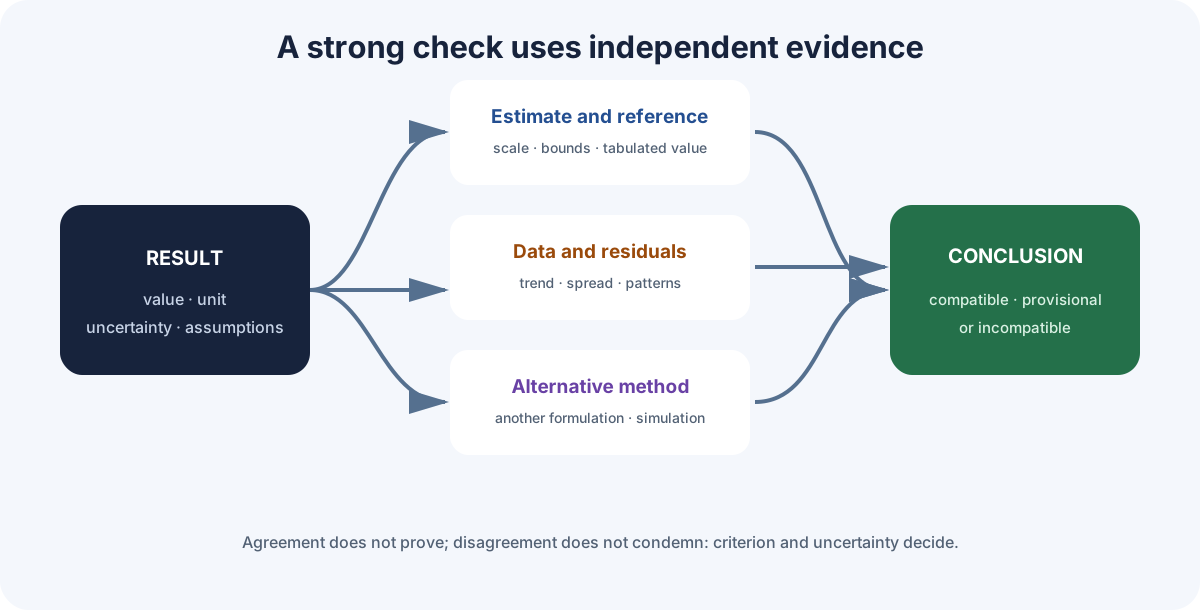
Sources for comparison
- a measured value or a tabulated reference with a known source;
- a manual estimate or a calculation using an equivalent formulation;
- a plot, simulation, or special case whose behavior is known;
- a conservation law, a bound, or an earlier experimental result;
- another person's calculation performed without copying your steps.
The more independent the second route is, the better it can detect faults. Entering the same data and formula in another calculator checks only the arithmetic.
Record before comparing
Write down the result, unit, uncertainty, conditions, assumptions, and source. Two isolated numbers may look comparable while describing different systems, times, or conventions.
Phyxio AI can suggest an alternative route or review the steps, but its answer is another working hypothesis: check it against the content, tools, and sources of the problem.
Measure the discrepancy
Before deciding whether two results agree, express how far apart they are.
For a result and a reference :
[
]
The relative difference from a nonzero reference is
[
]
Choose the right measure
- Absolute difference keeps the unit and shows the actual separation.
- Relative difference compares discrepancies across different scales.
- A percentage requires stating which value is the reference.
- If neither value is privileged, use a symmetric difference or report both without calling either one an “error.”
If , the relative difference above is undefined. Use absolute difference, a justified physical scale, or uncertainties.
A numerical discrepancy does not explain its cause. It may come from rounding, data, units, the model, measurement, or an unsuitable reference.
Uncertainty and compatibility
Two measurements need not match digit for digit. They must be compared using their uncertainties and the chosen confidence level.
If and are independent, an indicative check uses
[
]
A small means the difference is reasonable relative to the combined uncertainty; a large one calls for investigation. The threshold depends on how the uncertainties are defined and on the statistical criterion used.
Interval overlap is not enough
Checking whether two error bars touch gives a first impression, not a universal rule. Determine whether they represent standard uncertainties, expanded uncertainties, confidence intervals, or another convention.
If they are incompatible
Review correlations, calibration, resolution, bias, experimental conditions, uncertainty propagation, and the model's domain. Do not enlarge an uncertainty merely to force agreement.
The uncertainty and residuals leaves develop the formal calculations; the key idea here is that a difference must be judged against the available precision.
Precision and significant figures
The reported result must not imply more precision than the data and method allow.
Practical rule
- Keep extra digits during intermediate calculations.
- First calculate or estimate the final uncertainty.
- Round the uncertainty according to the chosen convention, usually to one or two significant figures.
- Round the value to the same decimal place as the uncertainty.
Example:
[
]
may be reported as
[
]
Avoid mechanical rules
“The result has as many figures as the input with the fewest figures” is only a classroom approximation. For products, sums, fits, and correlated quantities, propagated uncertainty is a stronger guide.
Do not round every step: accumulated rounding can alter the final digit. Do not add decimals merely because the calculator displays them. Visual precision is not physical accuracy.
Data, plots, and residuals
A single number can hide a systematic model failure. When several observations are available, check the complete dataset.
What to inspect
- plot data and model with axes, units, and uncertainties;
- check whether the model reproduces the scale, trend, curvature, and possible thresholds;
- calculate residuals ;
- look for residuals distributed around zero without an obvious pattern;
- identify outliers, but do not remove them without a documented cause;
- use a suitable statistical measure when uncertainties are known.
A curved residual pattern suggests an incomplete functional form. A common displacement points to bias or an offset. Increasing spread may indicate nonconstant uncertainty.
A plot is not proof
Changing axis scales or limits can hide discrepancies. Read the plot interpretation and use Experiment mode to vary parameters, then check the behavior against the data and assumptions.
The fitting, residuals, and chi-square content explains how to quantify these tests more rigorously.
Make a final decision
Validation ends with a reasoned conclusion, not a collection of green ticks.
Checklist
- Does it answer exactly the requested quantity?
- Are unit, dimension, sign, and scale consistent?
- Does it pass limiting cases, bounds, and conservation laws?
- Does the reference describe the same system and conditions?
- Is the discrepancy small relative to the uncertainty?
- Do data, plot, and residuals support the model without clear patterns?
- Do the reported figures reflect the actual precision?
- Does a sufficiently independent route reach a compatible conclusion?
- Are assumptions, source, and domain of validity stated?
If results disagree
- Confirm that you are comparing the same quantity and convention.
- Locate whether the disagreement starts in the data, units, calculation, model, or reference.
- Repeat only the affected section through an independent route.
- Document changes; do not silently replace the result.
- If it remains unresolved, report the discrepancy and limit the conclusion.
Finally classify the result as compatible, provisional, or incompatible, explaining the criterion. Validation means justifying a degree of confidence, not promising absolute certainty.